Ksama Arora
CREATE AND EXPLORE RESPONSIBLE AI DASHBOARD FOR A MODEL IN AZURE ML
Microsoft’s 5 Responsible AI principles:
- Fairness and inclusiveness: Models should treat everyone fairly and avoid different treatment for similar groups.
- Reliability and safety: Models should be reliable, safe, and consistent. You want a model to operate as intended, handle unexpected situations well, and resist harmful manipulation.
- Privacy and security: Be transparent about data collection, use, and storage, to empower individuals with control over their data. Treat data with care to ensure an individual’s privacy.
- Transparency: When models influence important decisions that affect people’s lives, people need to understand how those decisions were made and how the model works.
- Accountability: Take accountability for decisions that models may influence and maintain human control.
To help implement Responsible AI principle, you can create Responsible AI Dashboard.
Responsible AI (RAI) Dashboard
Responsible AI (RAI) Dashboard is a Microsoft tool that provides a single user interface to help implement RAI in practice effectively and efficiently.
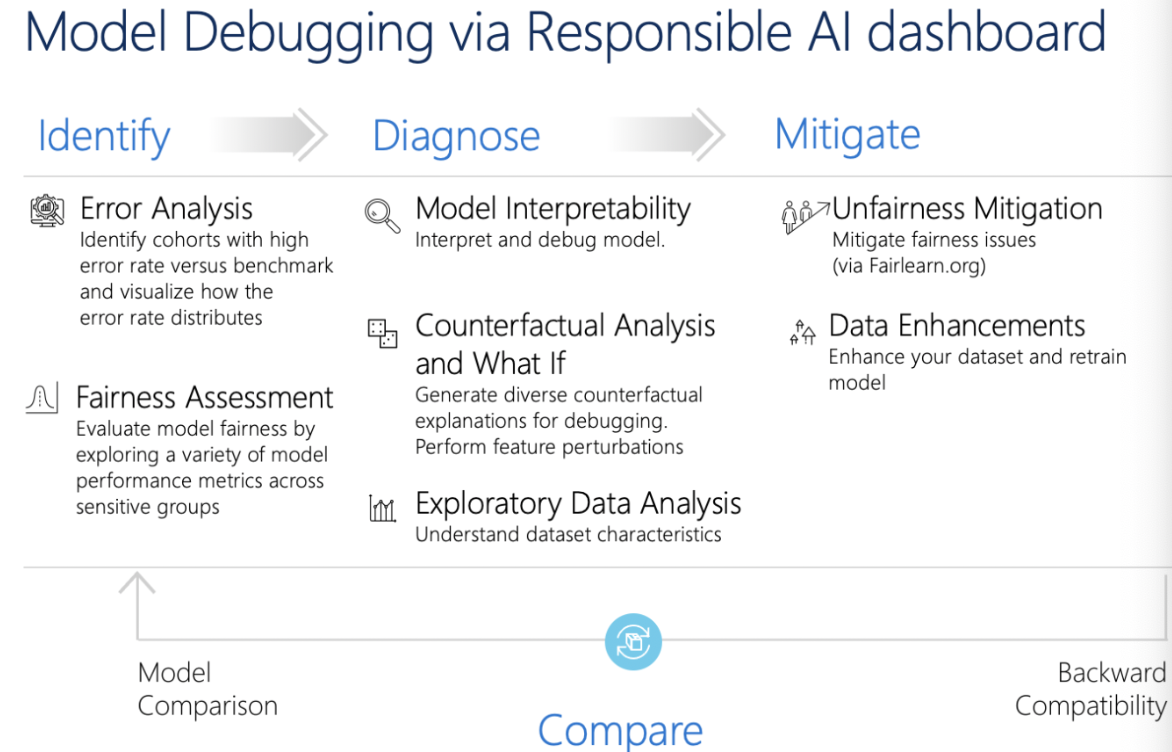
Explore Responsible AI components
The available tool components and the insights you can use are:
- Add Explanation to RAI Insights dashboard: Interpret models by generating explanations. Explanations show how much features influence the prediction.
- Add Causal to RAI Insights dashboard: Use historical data to view the causal effects of features on outcomes.
- Add Counterfactuals to RAI Insights dashboard: Explore how a change in input would change the model’s output.
- Add Error Analysis to RAI Insights dashboard: Explore the distribution of your data and identify erroneous subgroups of data.
Create Responsible AI dasboard
To create RAI dashboard, need to create a pipeline by using built-in components. The pipeline should:
- Start with RAI Insights dashboard constructor (The first component in the pipeline to create RAI Dasboard)
- Include one of the RAI tool components
- End with Gather RAI Insights dashboard to collect all insights into one dashboard
- Optionally you can also add the Gather RAI Insights score card at the end of your pipeline
IMP NOTE:
A Responsible AI scorecard automatically generates cohort analysis reports, including MAE per cohort in the dataset
When you run the pipeline, a Responsible dashboard (and scorecard) is generated and associated with model. After training and registering of model, you can create RAI dashboard in 3 ways:
- Using the Command Line Interface (CLI) extension for Azure Machine Learning.
- Using the Python Software Development Kit (SDK).
- Using the Azure ML studio for a no-code experience.
Using Python SDK to build and run pipeline
- Step 1: Retrieve the components you want to use. Start with pipeline with the RAI Insights dashboard constructor component
rai_constructor_component = ml_client_registry.components.get(
    name="microsoft_azureml_rai_tabular_insight_constructor", label="latest"
)
- Step 2: Add available insights, like explanations, by retrieving the Add Explanation to RAI Insights dashboard component
rai_explanation_component = ml_client_registry.components.get(
    name="microsoft_azureml_rai_tabular_explanation", label="latest"
)
- Step 3: Pipeline should end with Gather RAI Insights dashboard component
rai_gather_component = ml_client_registry.components.get(
    name="microsoft_azureml_rai_tabular_insight_gather", label="latest"
)
- Step 4: Once you have components, now build the pipeline
from azure.ai.ml import Input, dsl
from azure.ai.ml.constants import AssetTypes

@dsl.pipeline(
    compute="aml-cluster",
    experiment_name="Create RAI Dashboard",
)
def rai_decision_pipeline(
    target_column_name, train_data, test_data
):
    # Initiate the RAIInsights
    create_rai_job = rai_constructor_component(
        title="RAI dashboard diabetes",
        task_type="classification",
        model_info=expected_model_id,
        model_input=Input(type=AssetTypes.MLFLOW_MODEL, path=azureml_model_id),
        train_dataset=train_data,
        test_dataset=test_data,
        target_column_name="Predictions",
    )
    create_rai_job.set_limits(timeout=30)

    # Add explanations
    explanation_job = rai_explanation_component(
        rai_insights_dashboard=create_rai_job.outputs.rai_insights_dashboard,
        comment="add explanation",
    )
    explanation_job.set_limits(timeout=10)

    # Combine everything
    rai_gather_job = rai_gather_component(
        constructor=create_rai_job.outputs.rai_insights_dashboard,
        insight=explanation_job.outputs.explanation,
    )
    rai_gather_job.set_limits(timeout=10)

    rai_gather_job.outputs.dashboard.mode = "upload"

    return {
        "dashboard": rai_gather_job.outputs.dashboard,
    }
- Step 5: Run the pipeline and after successful completion, select view to see RAI dashboard from pipeline overview. See RAI dashboard in RAI tab of registered model.
EVALUATE RESPONSIBLE AI DASHBOARD
EXPLORE ERROR ANALYSIS:
With error analysis feature, can review and understand how error (false predictions) are distributed in dataset. In error analysis, can explore 2 types of visuals:
- Error tree map: Provides an overview the combination of subgroups that would result in the model making more false predictions
- Error heat map: Presents a grid overview of a models error over the scale of one or two features.
ERROR EXPLANATIONS:
Understand how each input features influences the models predictions (how model reaches a certain predictions). Run model explainers to calculate the feature importance. Explore two types of feature importance:
- Aggregate feature importance: Shows how each feature in the test data influences the model’s predictions overall.
- Individual feature importance: Shows how each feature impacts an individual prediction
EXPLORE COUNTERFACTUALS:
Counterfactuals are used to explore how models output would change based on a change in input. Explore counterfactual what-if examples by selecting a data point and the desired models predictions for that point.
EXPLORE CASUAL ANALAYSIS:
Casual analysis uses statistical techniques to estimate the average effect of a feature on a desired prediction. It analyzes how certain interventions or treatments may result in a better outcome, across a population or for a specific individual. Three available tabs including causal analysis:
- Aggregate causal effects: Shows the average causal effects for predefined treatment features (the features you want to change to optimize the model’s predictions).
- Individual causal effects: Shows individual data points and allows you to change the treatment features to explore their influence on the prediction i.e. Shows how each feature influences an individual prediction
- Treatment policy: Shows which parts of your data points benefit most from a treatment.
| Model debugging | Business decision making |
|---|---|
| Error analysis | Causal analysis |
| Data explorer | Counterfactual what-if |
| Model overview | |
| Fairness assessment | |
| Model interpretability | |
| Counterfactual what-if |